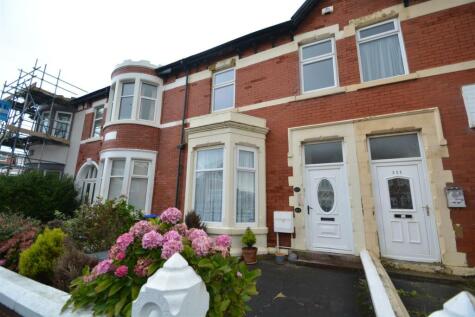
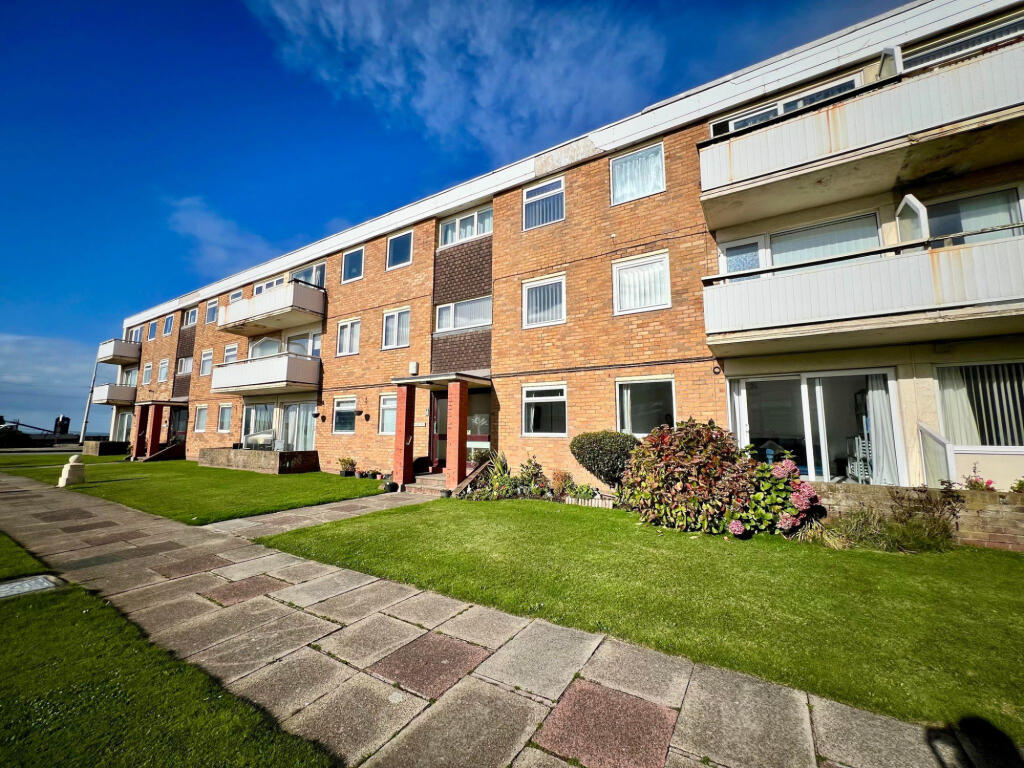
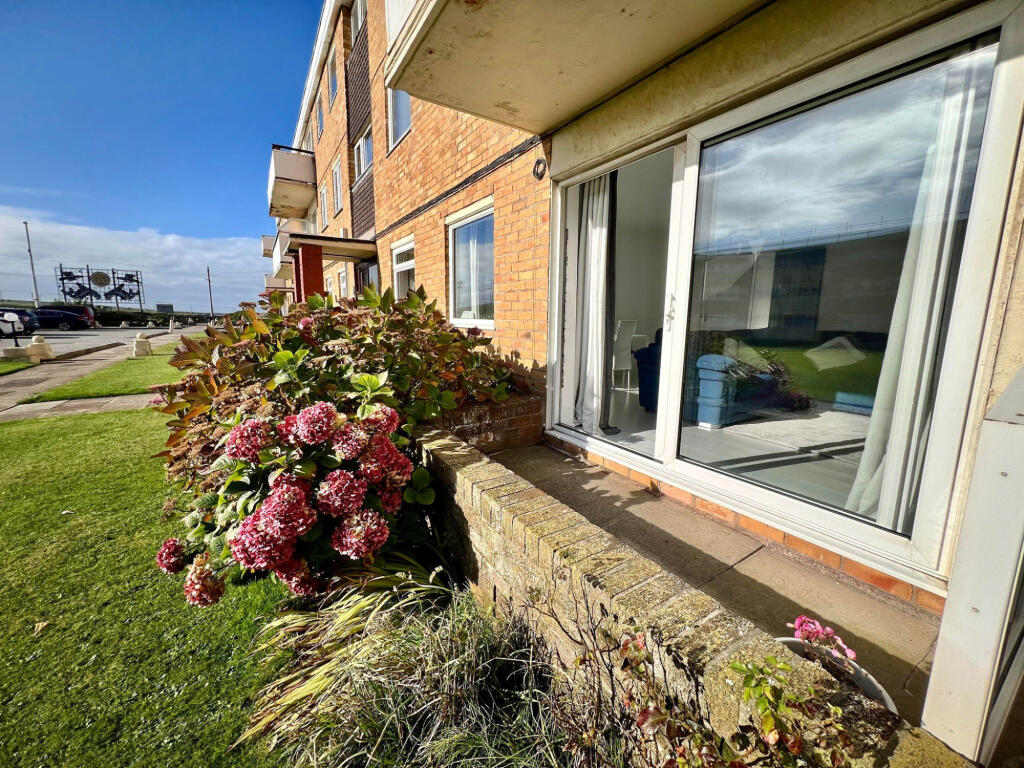
2 Bed Flat, Cash/Bridging Only, Blackpool, FY2 9PY, £100,000
ValuationOvervalued
| Sold Prices | £59K - £247K |
| Sold Prices/m² | £1K/m² - £2.1K/m² |
| |
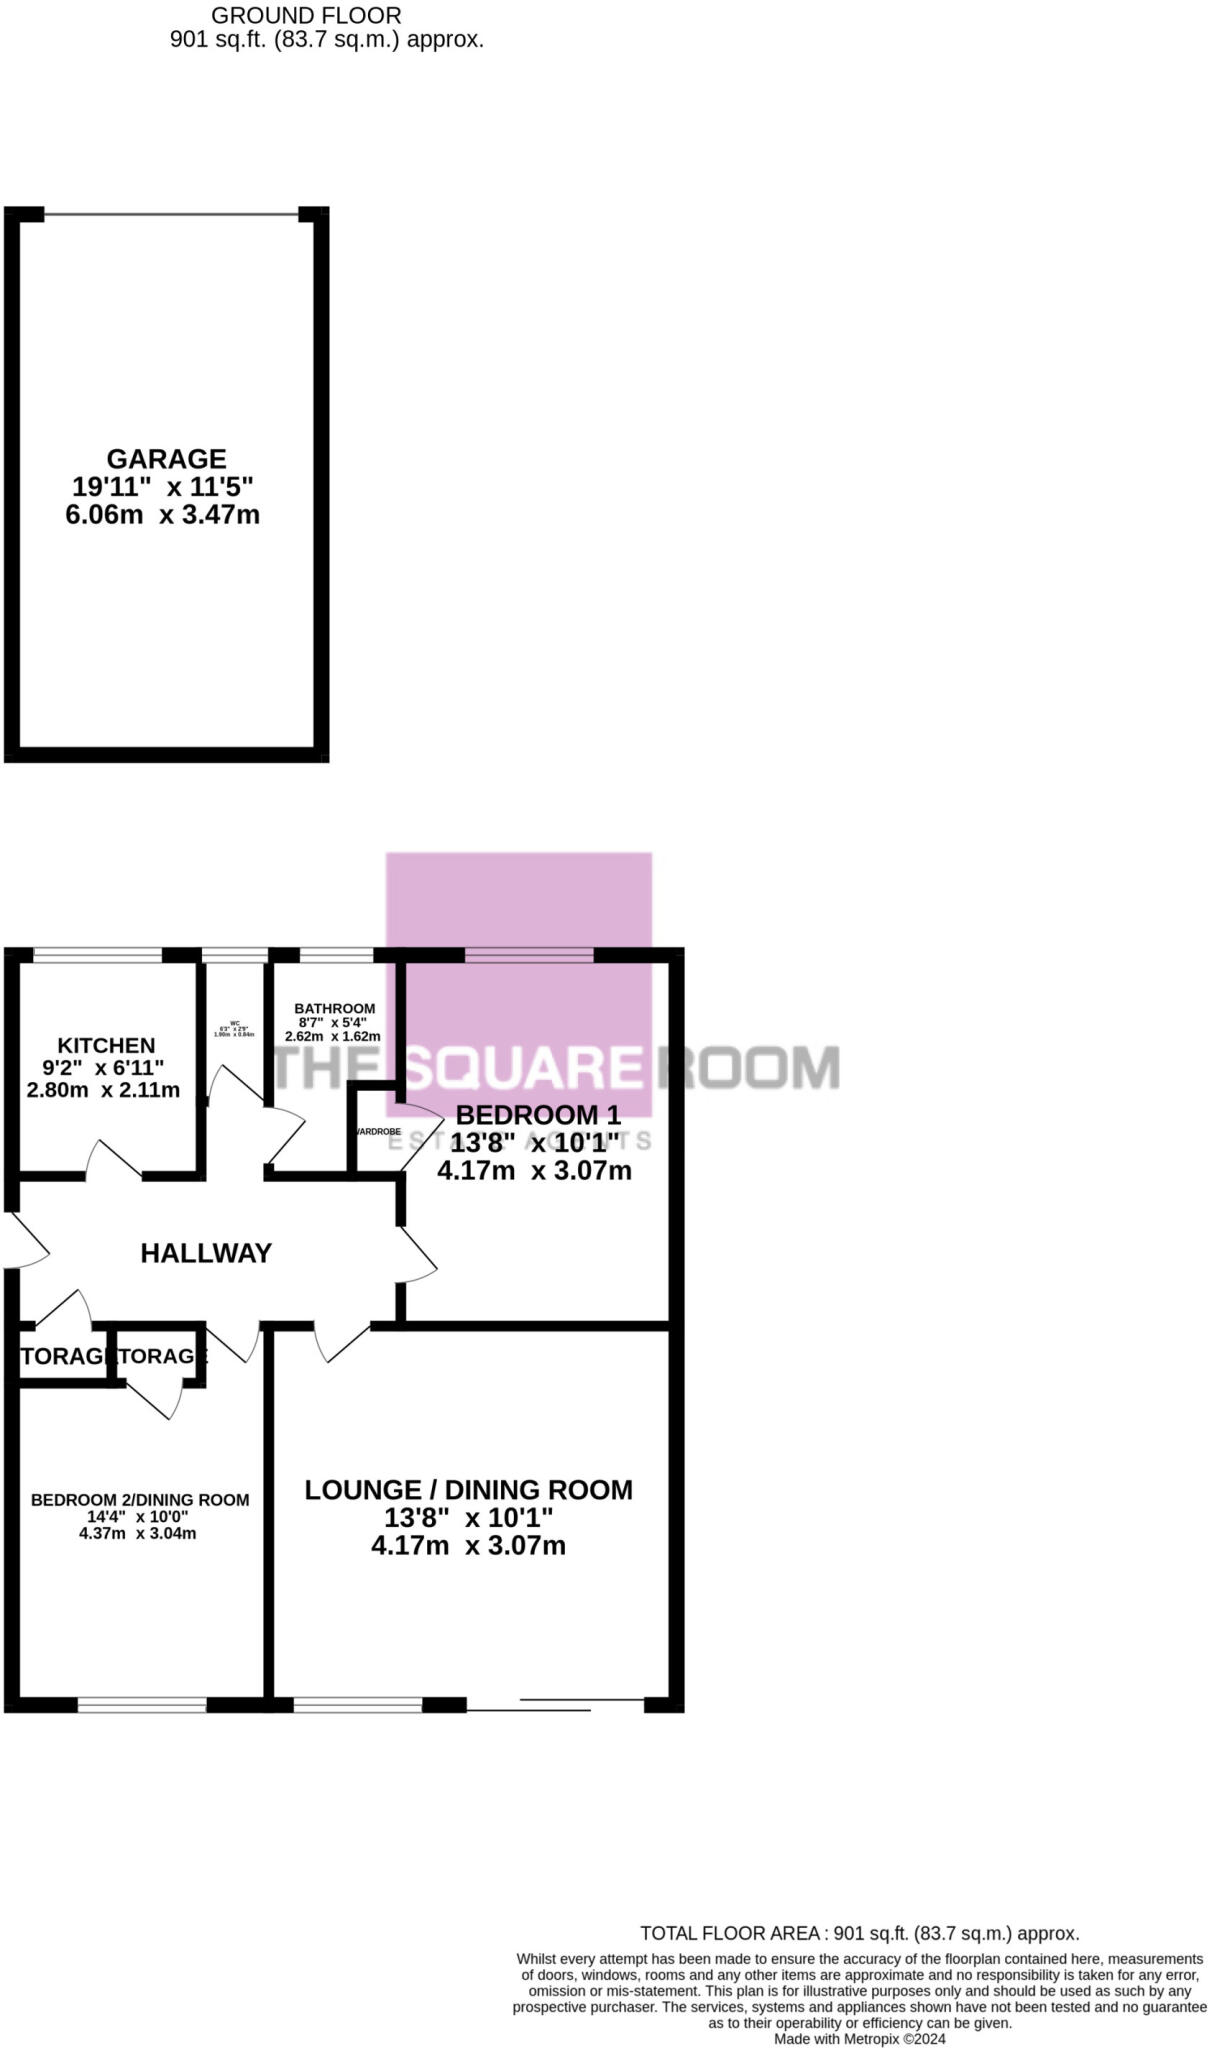
Square Metres | ~68.11 m² |
| Price/m² | £1.5K/m² |
Value Estimate | £90,624 |
| |
End Value (After Refurb) | £106,624 |
Uplift in Value | +7% |
Investment Opportunity
Cash In | |
Purchase Finance | Bridging Loan |
Deposit (25%) | £25,000 |
Stamp Duty & Legal Fees | £6,200 |
Refurb Costs | £27,830 |
Bridging Loan Interest | £2,625 |
Total Cash In | £63,405 |
| |
Cash Out | |
Monetisation | FlipRefinance & Rent |
Revaluation | £106,624 |
Mortgage (After Refinance) | £79,968 |
Mortgage LTV | 75% |
Cash Released | £4,968 |
Cash Left In | £58,438 |
Equity | £26,656 |
Rent Range | £550 - £3,000 |
Rent Estimate | £915 |
Running Costs/mo | £536 |
Cashflow/mo | £379 |
Cashflow/yr | £4,546 |
ROI | 7% |
Gross Yield | 11% |
Local Sold Prices
31 sold prices from £59K to £247K, average is £85K. £1K/m² to £2.1K/m², average is £1.3K/m².
Local Rents
29 rents from £550/mo to £3K/mo, average is £695/mo.
Local Area Statistics
Population in FY2 | 24,589 |
Population in Blackpool | 133,713 |
Town centre distance | 2.57 miles away |
Nearest school | 0.60 miles away |
Nearest train station | 1.10 miles away |
| |
Rental demand | Balanced market |
Rental growth (12m) | +50% |
Sales demand | Balanced market |
Capital growth (5yrs) | +18% |
Property History
Listed for £100,000
February 17, 2025
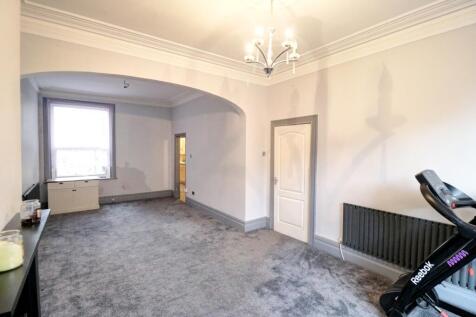
Floor Plans
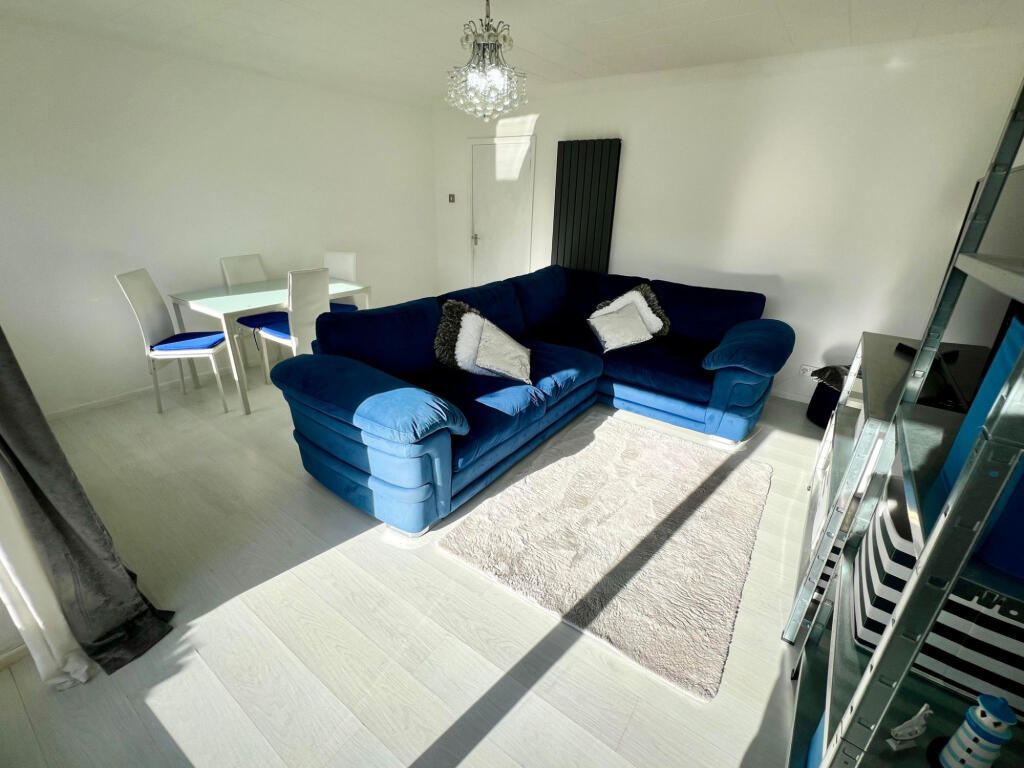
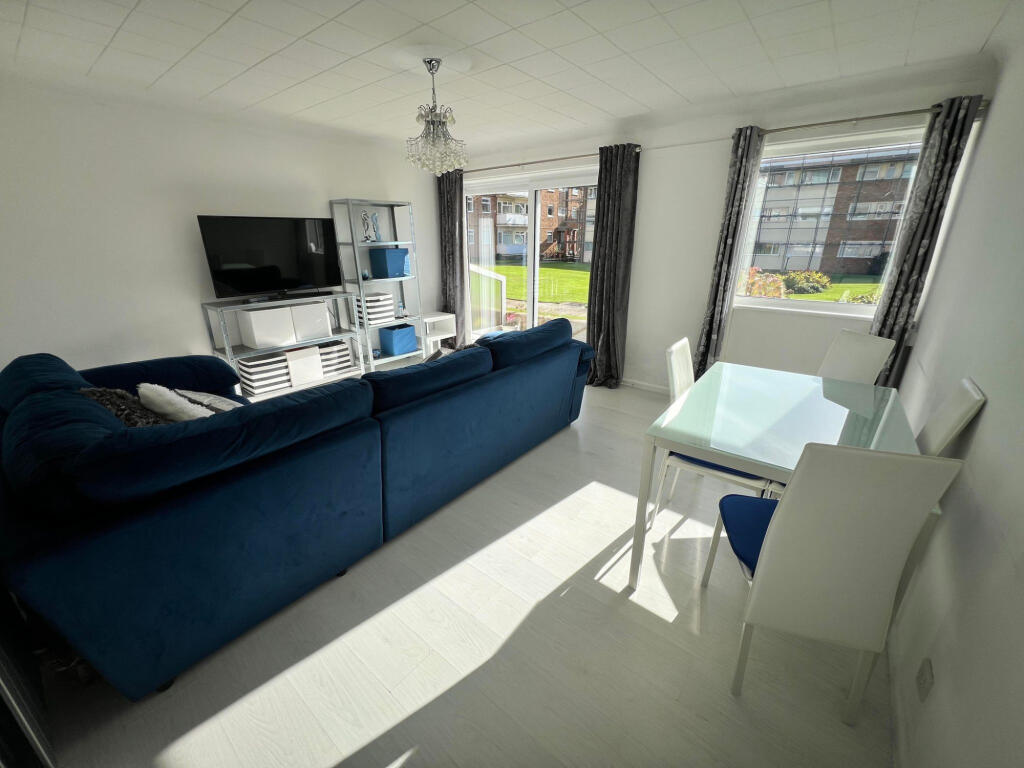
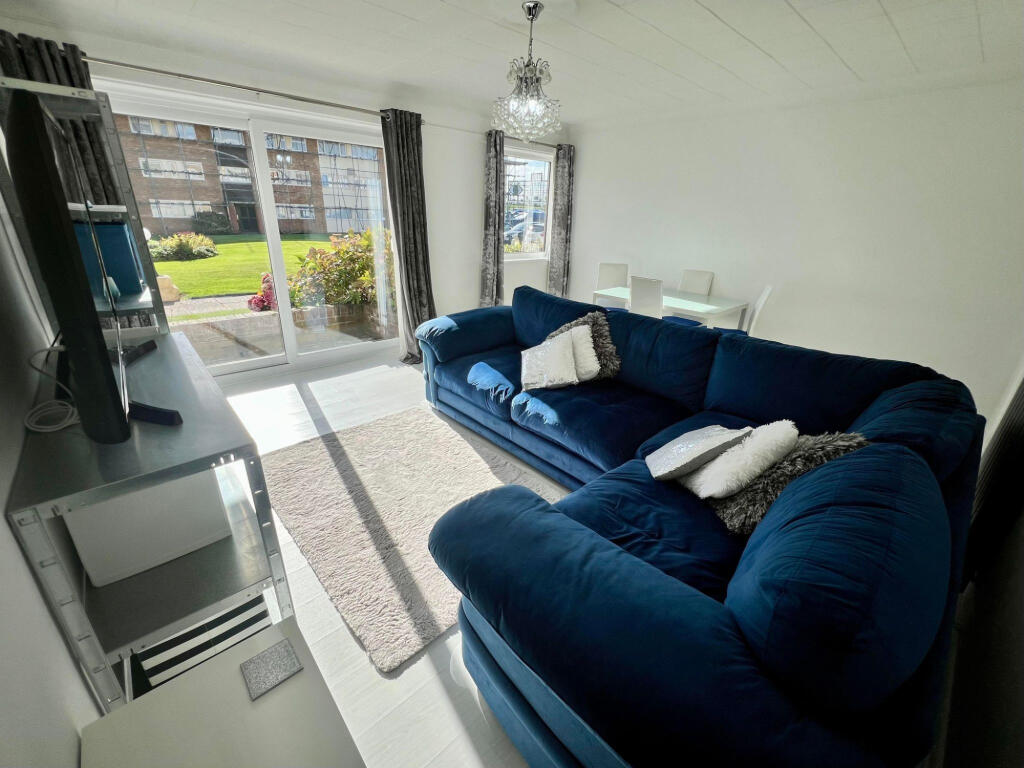
Description
Similar Properties
Like this property? Maybe you'll like these ones close by too.