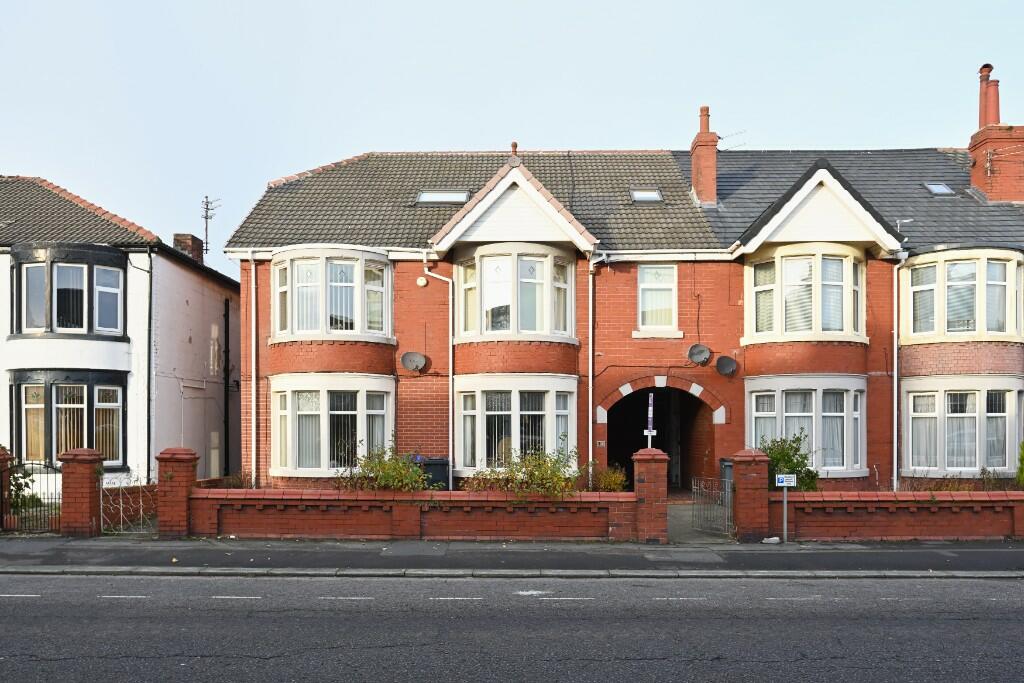
Our latest listing is a 2 bedroom flat located in Blackpool. It is in close proximity to valuable amenities, is able to generate rewarding rental returns and has a tenant currently situated.
For investors looking to expand their portfolio, this is a fantastic opportunity!
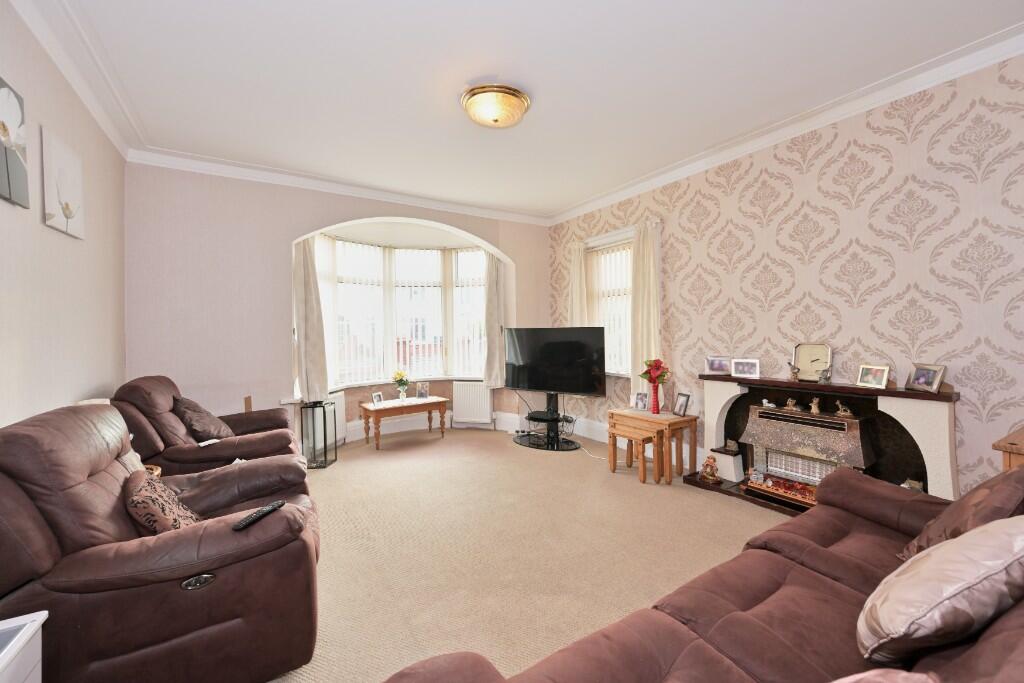
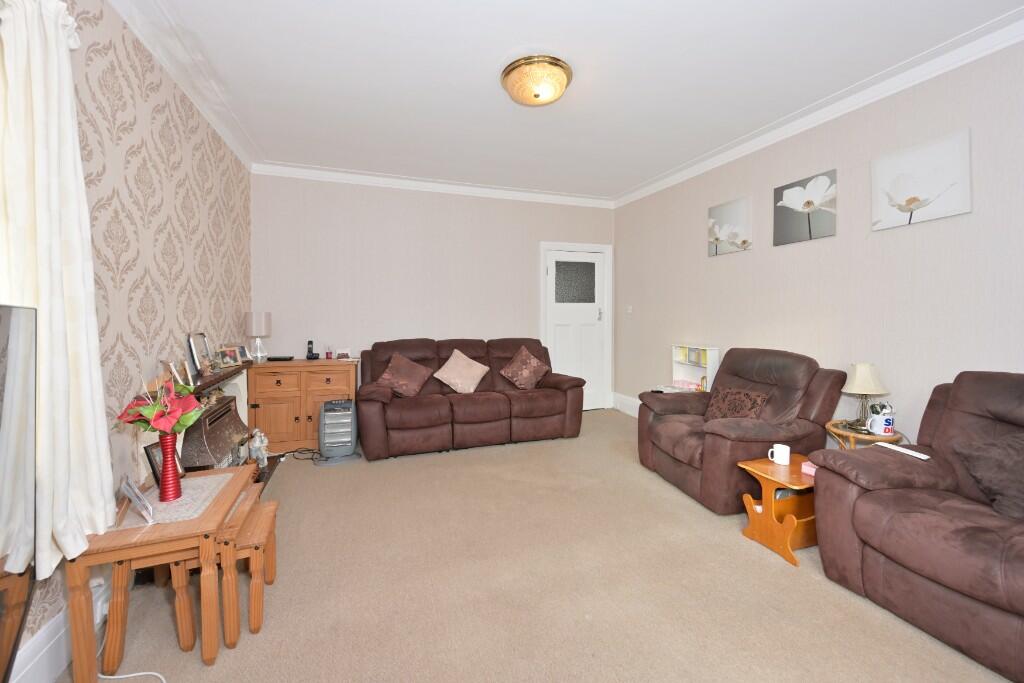
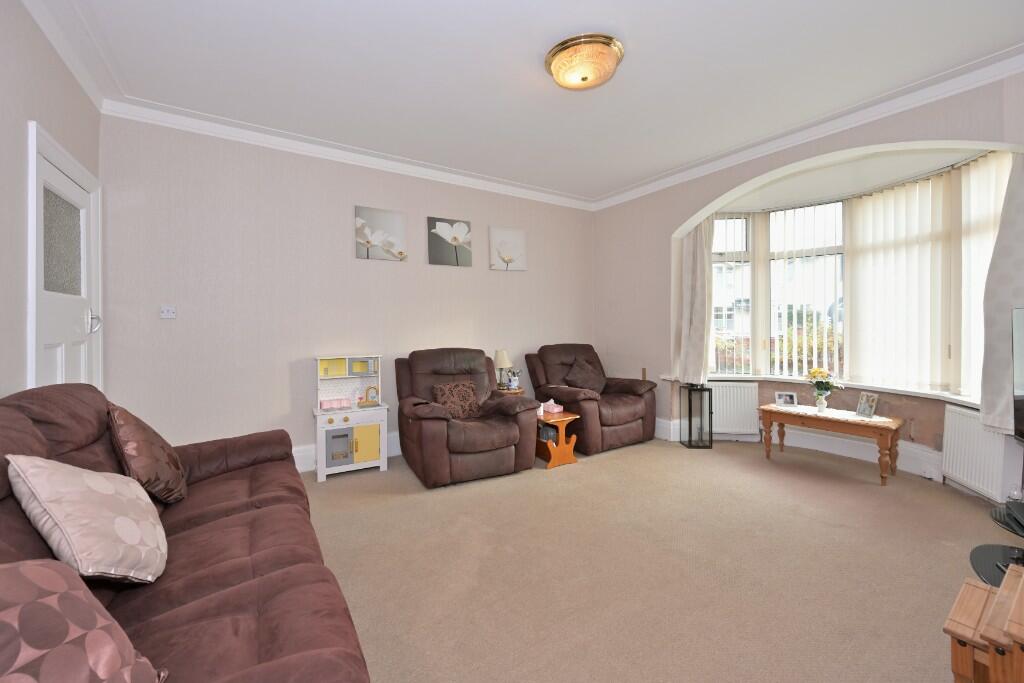
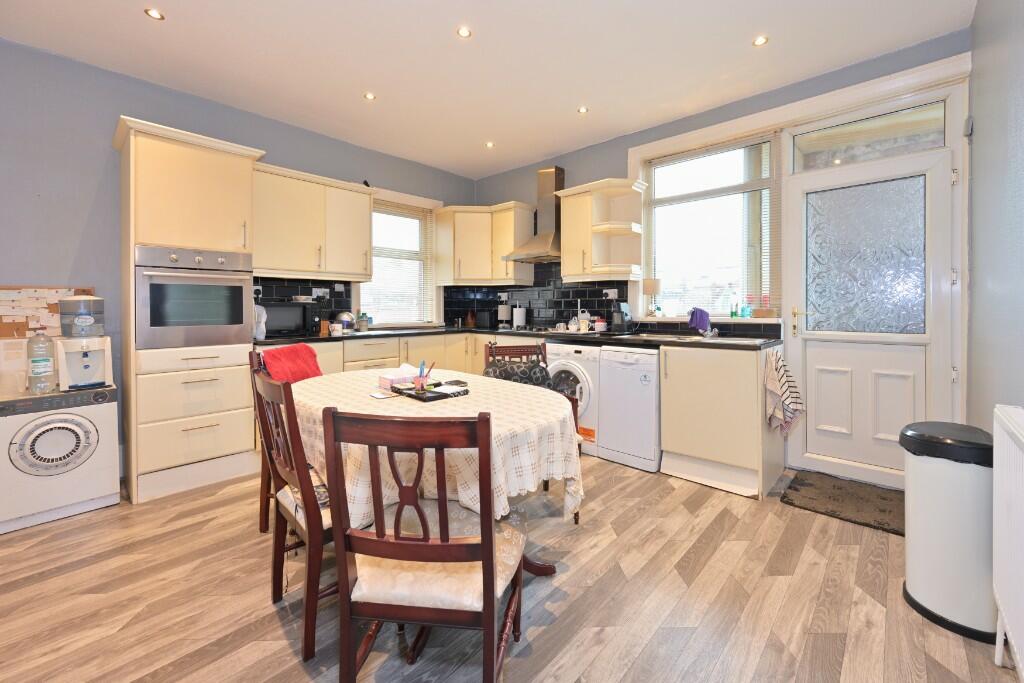
This well-kept home features 2 bedrooms, a spacious lounge, and modern kitchen.
Investment details
It currently produces an annual gross income of £6720 which could be increased by the new owner to a market rate of £12,000 with long term tenants currently situated. Considering the purchase price, this will make for a worthwhile addition to an investors property portfolio.
For greater detail on this property's investment potential, please see the Let Property Pack linked below.
If you are interested, please call us.
Tenancy Details
The current tenants have lived in the property for several years and have consistently paid their rent for the duration of their stay. They do not have any intentions to move out so hope to remain in the property.
Let Property Sales are committed to facilitating a smooth transaction process and to allow for maximum commitment to the sale from both parties, a fully refundable buyers premium may apply to secure a property. This amount is not an additional cost and is refunded in the event of non completion.
Agent Details
Let Property Sales & Management, Glasgow
0141 673 7973
Next Steps?
This deal was sourced from Rightmove. Contact the landlord/agent for a viewing now 💪
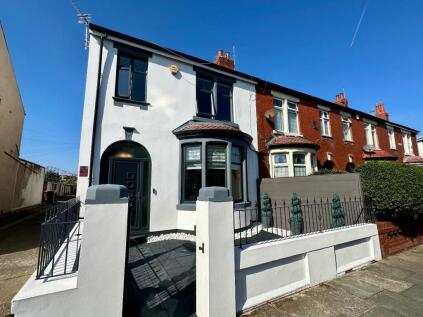
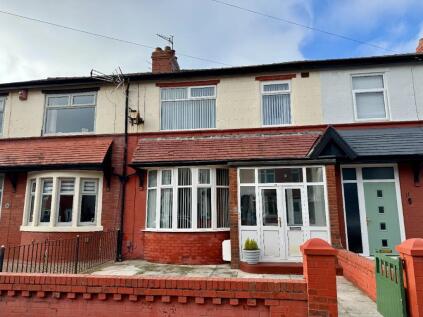
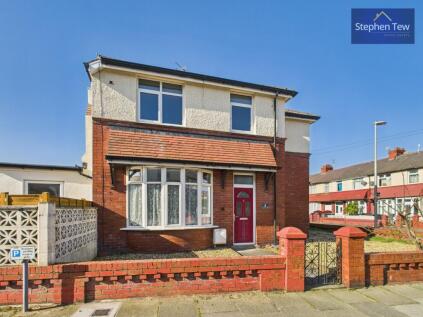
Similar Properties
Like this property? Maybe you'll like these ones close by too.